Fig. 7
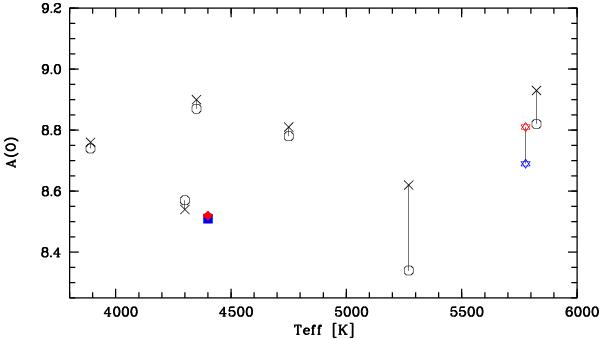
Oxygen abundances derived from the [O i] line at 630 nm (circles) and the line at 636 nm (crosses) as a function of the effective temperature. For plotting purposes the abundances of HD 26297 are upshifted by 1 dex and represented as filled blue squares and red lozenges, respectively. The solar values are indicated as blue and red stars.
Current usage metrics show cumulative count of Article Views (full-text article views including HTML views, PDF and ePub downloads, according to the available data) and Abstracts Views on Vision4Press platform.
Data correspond to usage on the plateform after 2015. The current usage metrics is available 48-96 hours after online publication and is updated daily on week days.
Initial download of the metrics may take a while.