Free Access
Fig. 6
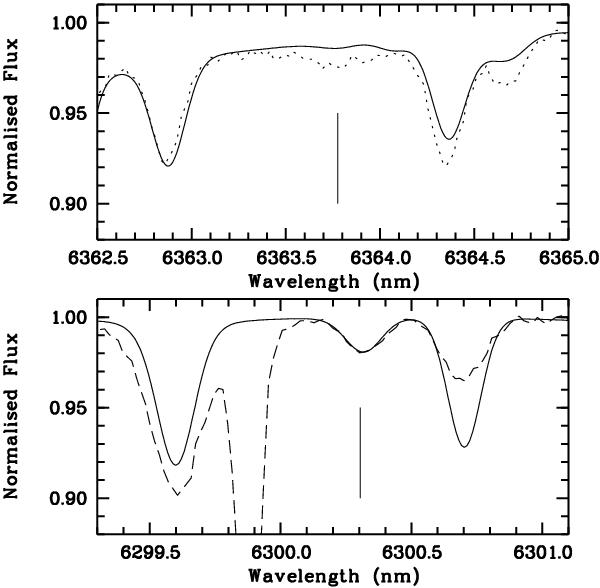
Observed flux spectrum of Procyon showing the 630 nm line (dashed) and the 636 nm line (dotted) overimposed on an ATLAS+SYNTHE synthetic spectrum (A(O) = 8.53, A(Ni) = 6.25 solid line). The vertical lines indicate the location of the forbidden O lines.
Current usage metrics show cumulative count of Article Views (full-text article views including HTML views, PDF and ePub downloads, according to the available data) and Abstracts Views on Vision4Press platform.
Data correspond to usage on the plateform after 2015. The current usage metrics is available 48-96 hours after online publication and is updated daily on week days.
Initial download of the metrics may take a while.