Free Access
Fig. 1
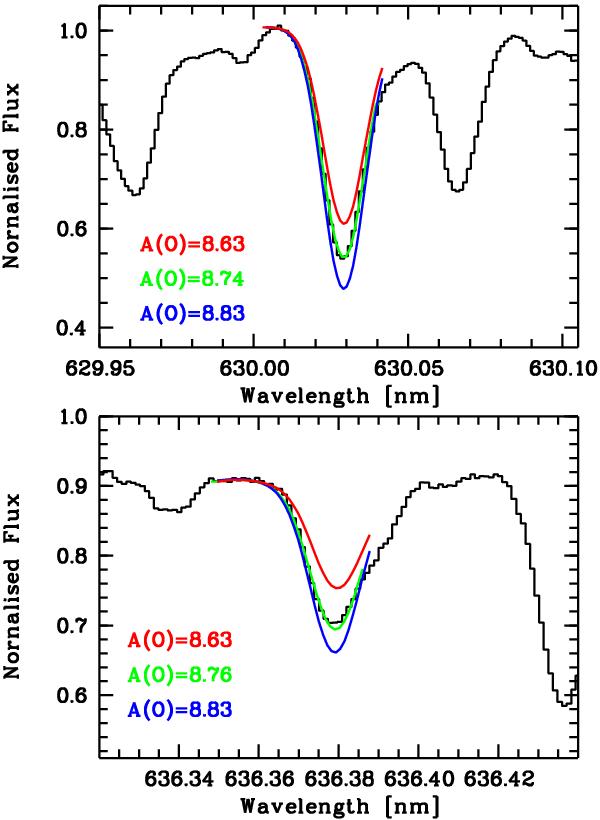
Spectra of Aldebaran observed with THEMIS (solid black) overimposed to the best fit (solid green) for the 630 nm and the 636 nm lines. In red and blue are two synthetic spectra that differ by about 0.1 dex in the O abundance from the best fit.
Current usage metrics show cumulative count of Article Views (full-text article views including HTML views, PDF and ePub downloads, according to the available data) and Abstracts Views on Vision4Press platform.
Data correspond to usage on the plateform after 2015. The current usage metrics is available 48-96 hours after online publication and is updated daily on week days.
Initial download of the metrics may take a while.