Free Access
Fig. 5
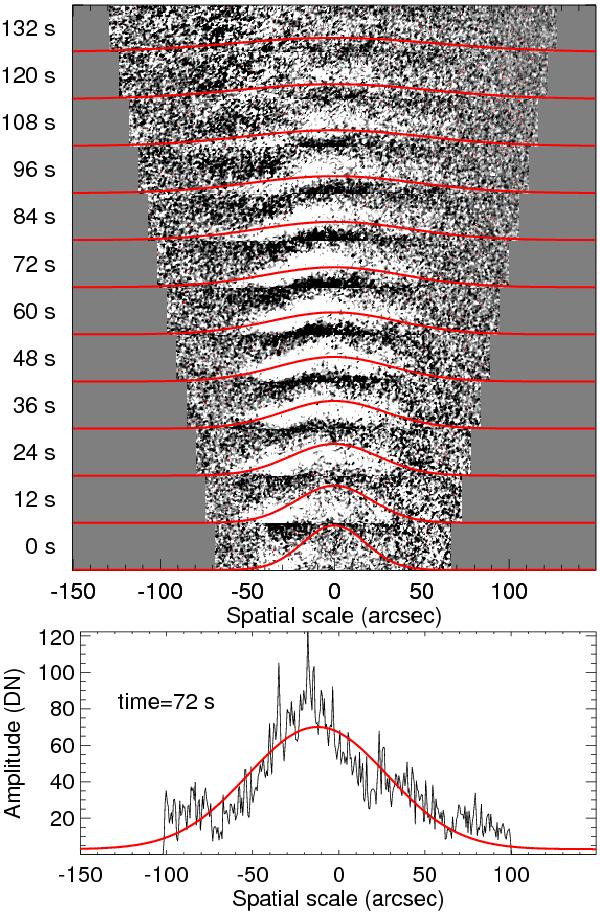
Top panel: wave front evolution of Train-2 as a function of time. The red curves are Gaussian profiles. The linearly increasing widths are adjusted manually. Bottom panel: an example (72 s) of the cross-sectional distribution of amplitude and the Gaussian fit (red curve).
This figure is made of several images, please see below:
Current usage metrics show cumulative count of Article Views (full-text article views including HTML views, PDF and ePub downloads, according to the available data) and Abstracts Views on Vision4Press platform.
Data correspond to usage on the plateform after 2015. The current usage metrics is available 48-96 hours after online publication and is updated daily on week days.
Initial download of the metrics may take a while.