Free Access
Fig. 4
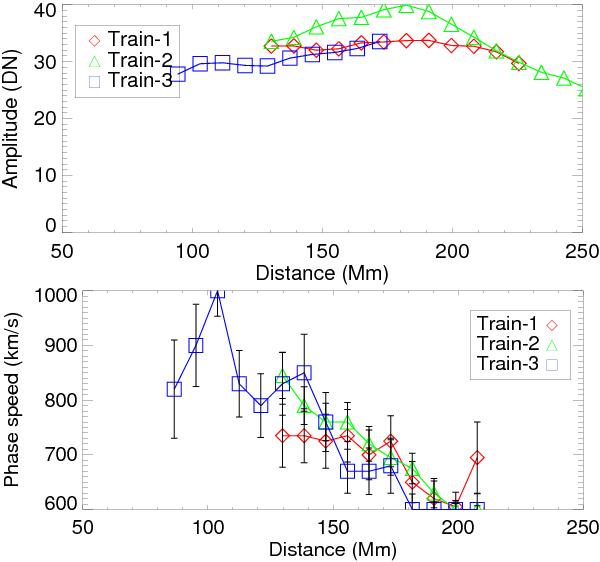
Wave amplitude (top) and projected phase speed (bottom) are plotted as a function of the distance to the flare epicenter for the wave trains. The red diamonds, green triangles, and blue squares denote the parameters of Train-1, -2, and -3, respectively.
This figure is made of several images, please see below:
Current usage metrics show cumulative count of Article Views (full-text article views including HTML views, PDF and ePub downloads, according to the available data) and Abstracts Views on Vision4Press platform.
Data correspond to usage on the plateform after 2015. The current usage metrics is available 48-96 hours after online publication and is updated daily on week days.
Initial download of the metrics may take a while.