Fig. 2
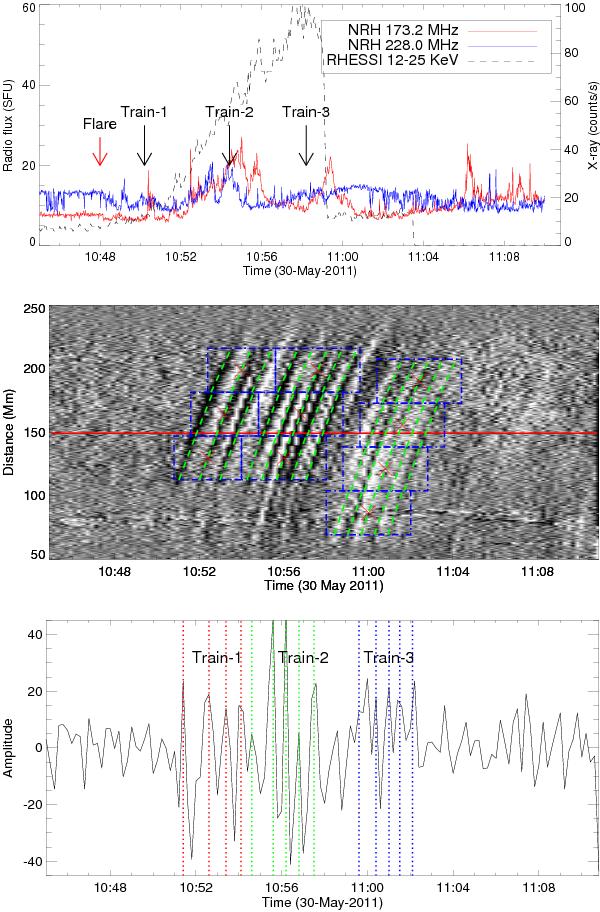
Top panel: the radio emission of AR11227 in NRH 173.2 MHz and 228.0 MHz band and the RHESSI hard X-ray count rate in 12−25 KeV. The start time of the flare, Train-1, Train-2 and Train-3 are labeled at the time axis. Middle panel: the time-distance plot for L3. The samples used to measure the phase speed are enclosed in blue rectangles, the centers are labeled in red cross. The measured results are over-plotted within each rectangle as dashed curves. Bottom panel: the amplitude variation at a fixed height of about 150 Mm (marked in red line in the middle panel). The dotted lines mark approximately the wave cycles of three wave trains in varied color.
Current usage metrics show cumulative count of Article Views (full-text article views including HTML views, PDF and ePub downloads, according to the available data) and Abstracts Views on Vision4Press platform.
Data correspond to usage on the plateform after 2015. The current usage metrics is available 48-96 hours after online publication and is updated daily on week days.
Initial download of the metrics may take a while.