Fig. 1
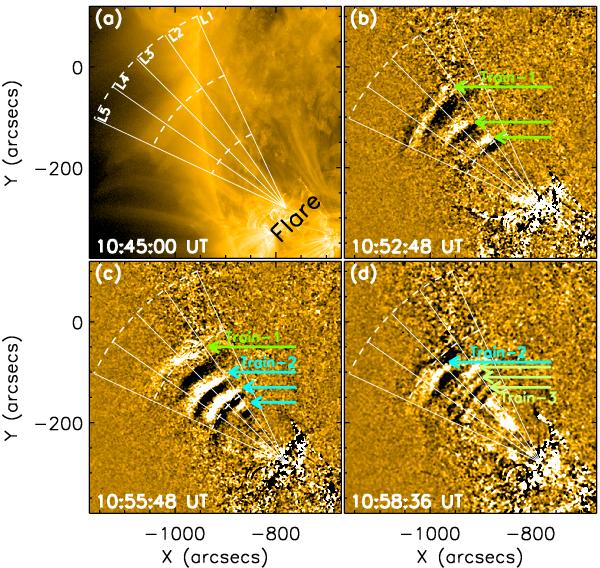
a) The AIA field-of-view in 171 Å, displaying the active region AR11227 and the flare epicenter. b)−d) Running difference images illustrate the QPF wave trains. The wavefronts of three distinct wave trains are marked by arrow groups in varied colors. The solid lines (L1-L5) forming a fan geometry are the cuts used in making time-distance arrays. The dashed arcs are concentric at the flare epicenter, the radii are 100 Mm, 200 Mm and 300 Mm, respectively.
Current usage metrics show cumulative count of Article Views (full-text article views including HTML views, PDF and ePub downloads, according to the available data) and Abstracts Views on Vision4Press platform.
Data correspond to usage on the plateform after 2015. The current usage metrics is available 48-96 hours after online publication and is updated daily on week days.
Initial download of the metrics may take a while.