Free Access
Fig. 7
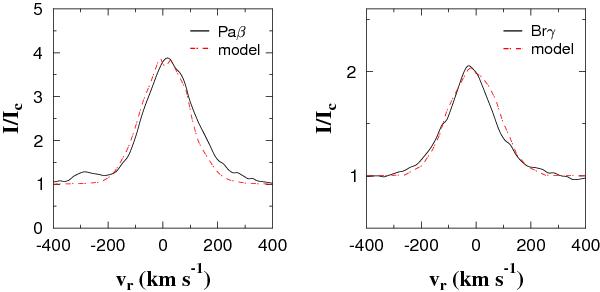
Paβ and Brγ observed (in black) and modelled (red dashed lines) profiles (see Sect. 4.8). Lines are normalised to the continuum.
Current usage metrics show cumulative count of Article Views (full-text article views including HTML views, PDF and ePub downloads, according to the available data) and Abstracts Views on Vision4Press platform.
Data correspond to usage on the plateform after 2015. The current usage metrics is available 48-96 hours after online publication and is updated daily on week days.
Initial download of the metrics may take a while.