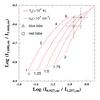
Fig. 5
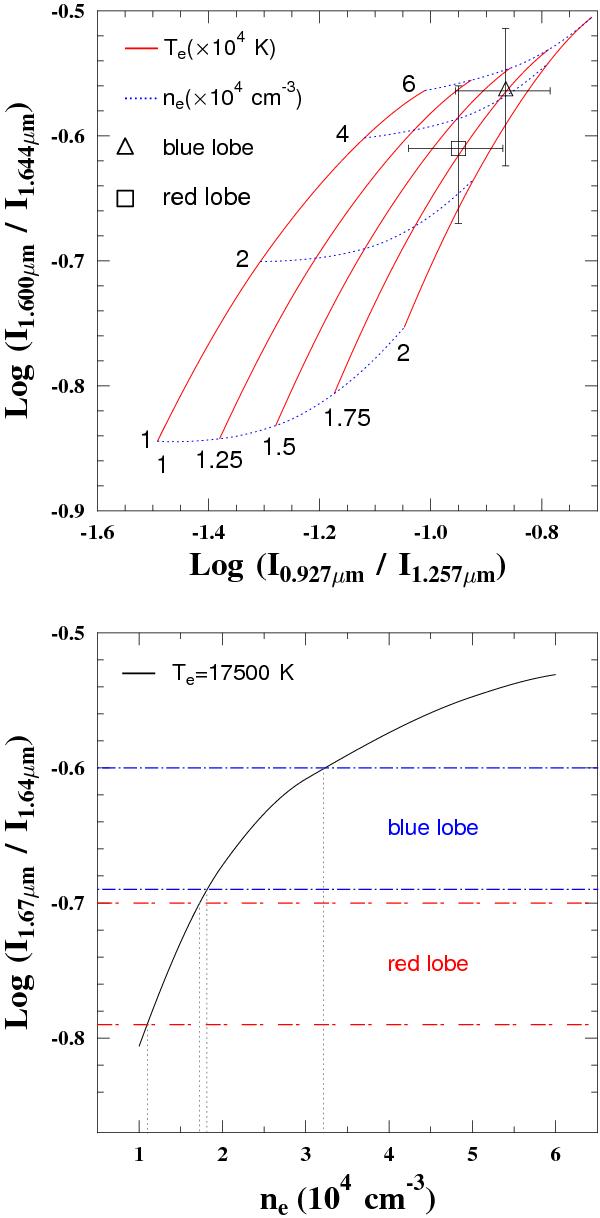
Electron temperature and density estimates. Top panel: diagnostic diagram employing line ratios sensitive to electron temperature (0.927 μm/1.257 μm, X axis) and density (1.600 μm/1.644 μm, Y axis). The grid displays a Te range from 10 000 to 20 000 K (red solid lines), and an ne range from 10 000 to 60 000 cm-3 (blue dotted lines). Triangle and square indicate the logarithmic dereddened line ratios and uncertainties observed in the blue- and red-shifted HVC of the jet, respectively. Bottom panel: predicted 1.677 μm/1.644 μm [Fe ii] line ratio as a function of the electron density ne. The solid curve corresponds to Te = 17 500 K. The dashed horizontal lines show the range of ratios observed for the blue and the red lobe. The intersections between the curve and the dashed lines illustrate the range of ne allowed by the ratios observed in the two lobes.
Current usage metrics show cumulative count of Article Views (full-text article views including HTML views, PDF and ePub downloads, according to the available data) and Abstracts Views on Vision4Press platform.
Data correspond to usage on the plateform after 2015. The current usage metrics is available 48-96 hours after online publication and is updated daily on week days.
Initial download of the metrics may take a while.