Fig. 3
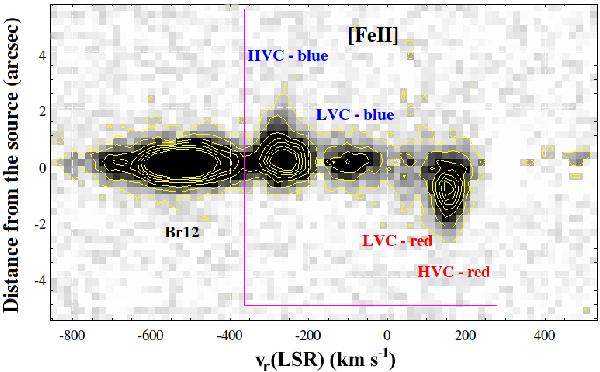
Position-velocity diagram of PV Cep around the 1.644 μm [Fe ii] line in the H-band. The continuum has been subtracted. The radial velocity on the X-axis refers to the [Fe ii] line and it is computed in the LSR. [Fe ii] blue- and red-shifted high- and low-velocity components as well as the Br 12 position are marked. The distance from the source is indicated on the Y-axis. The YSO position was derived through a Gaussian fit to the continuum before its removal from the spectral image. Positive distance is computed northwards (along the blue-shifted lobe direction). The contour levels of the spectral image are 3, 10, 20, 30, 40, 50, and 60 × the standard deviation to the mean background.
Current usage metrics show cumulative count of Article Views (full-text article views including HTML views, PDF and ePub downloads, according to the available data) and Abstracts Views on Vision4Press platform.
Data correspond to usage on the plateform after 2015. The current usage metrics is available 48-96 hours after online publication and is updated daily on week days.
Initial download of the metrics may take a while.