Fig. 7
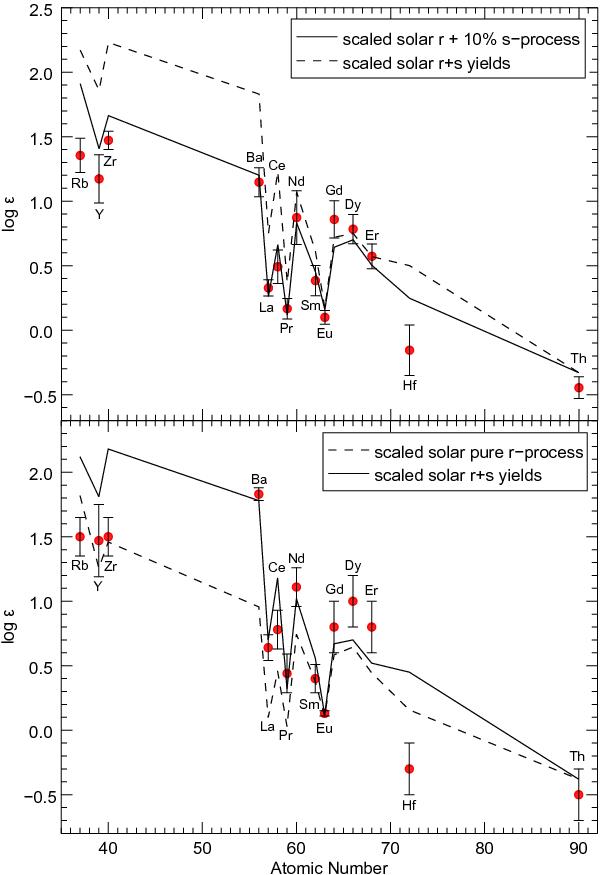
Upper panel: mean neutron-capture element abundance pattern for all “Ba-normal” (s-process deficient) stars in M 75. The solid line represents the best fit model for a scaled solar r-process plus 10% of the scaled solar s-process yields. The dashed line shows the scaled solar total r+s-process yields for comparison. The error bars represent the 1σ scatter of the derived element abundances of all s-process deficient stars; Bottom panel: derived n-capture elements abundances for star #901 – the most s-process rich star in our sample. The solid line represents the best fit model for a scaled solar total r+s-process yields. The dashed line shows the scaled solar pure r-process model for comparison. The error bars represent the random errors for this particular star.
Current usage metrics show cumulative count of Article Views (full-text article views including HTML views, PDF and ePub downloads, according to the available data) and Abstracts Views on Vision4Press platform.
Data correspond to usage on the plateform after 2015. The current usage metrics is available 48-96 hours after online publication and is updated daily on week days.
Initial download of the metrics may take a while.