Fig. 4
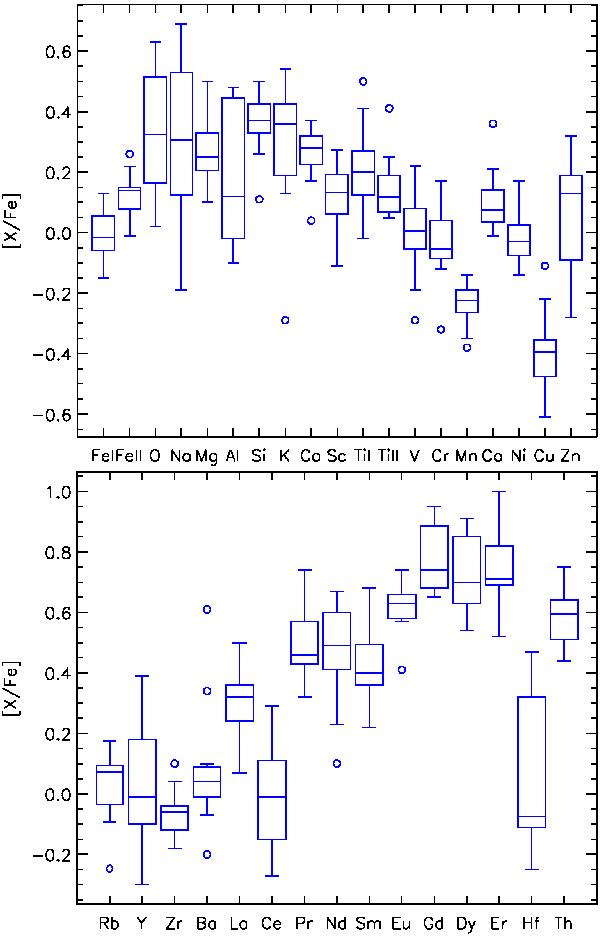
Boxplot of the derived abundances in M 75 relative to iron. Fe I and Fe II abundances are relative to the Fe I cluster mean. Neutral species are relative to Fe I and ionised species are relative to Fe II. The boxes designate the median values and IQR. The error bars show the minimum and the maximum value. Outliers are shown with circles. An outlier is defined if it deviates by more than 1.5 times the IQR.
Current usage metrics show cumulative count of Article Views (full-text article views including HTML views, PDF and ePub downloads, according to the available data) and Abstracts Views on Vision4Press platform.
Data correspond to usage on the plateform after 2015. The current usage metrics is available 48-96 hours after online publication and is updated daily on week days.
Initial download of the metrics may take a while.