Free Access
Fig. 2
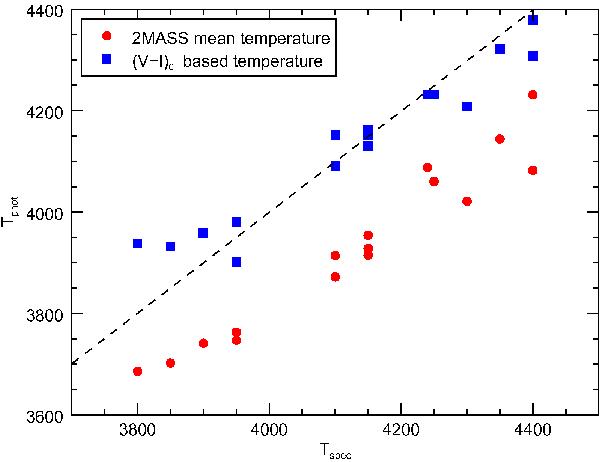
Comparison between the spectroscopic and photometric temperature estimates. The average temperature calculated from (V − J)0, (V − H)0, and (V − K)0 colours is indicated by red circles and the (V − I)0 calibration is indicated by blue squares. The dashed line is unity.
Current usage metrics show cumulative count of Article Views (full-text article views including HTML views, PDF and ePub downloads, according to the available data) and Abstracts Views on Vision4Press platform.
Data correspond to usage on the plateform after 2015. The current usage metrics is available 48-96 hours after online publication and is updated daily on week days.
Initial download of the metrics may take a while.