Fig. 6
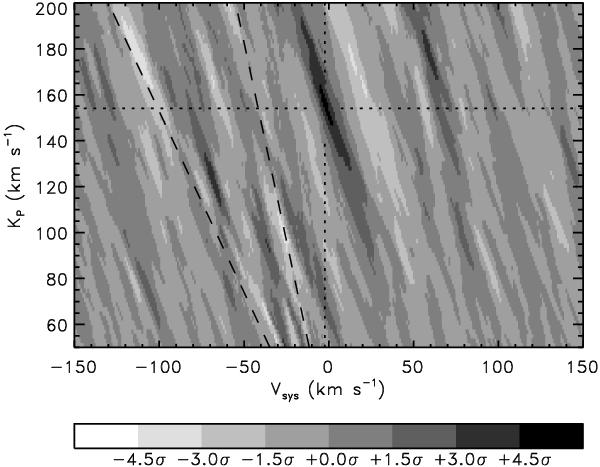
Combined cross-correlation values for all four detectors as a function of system velocity and Kp. The dashed line indicates where the stellar CO lines are expected to leave the strongest contamination signal. The area in between the dashed lines can also be contaminated by stellar residuals. The dotted lines indicate the system velocity of HD 189 733 and the peak position of Kp.
Current usage metrics show cumulative count of Article Views (full-text article views including HTML views, PDF and ePub downloads, according to the available data) and Abstracts Views on Vision4Press platform.
Data correspond to usage on the plateform after 2015. The current usage metrics is available 48-96 hours after online publication and is updated daily on week days.
Initial download of the metrics may take a while.