Free Access
Fig. 5
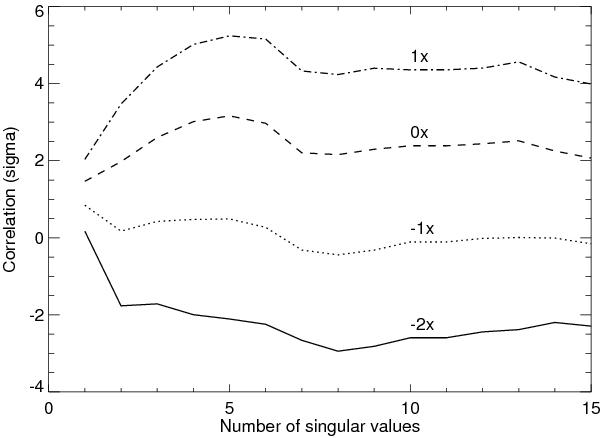
Total correlation at the planet position as a function of the number of subtracted singular values for detector 2 at 2.3 μm on 13 July 2011 for the planet model giving the highest correlation. Different lines indicate different multiplication factors of the inserted planet signal (see text), as indicated by the labels.
Current usage metrics show cumulative count of Article Views (full-text article views including HTML views, PDF and ePub downloads, according to the available data) and Abstracts Views on Vision4Press platform.
Data correspond to usage on the plateform after 2015. The current usage metrics is available 48-96 hours after online publication and is updated daily on week days.
Initial download of the metrics may take a while.