Free Access
Fig. 10
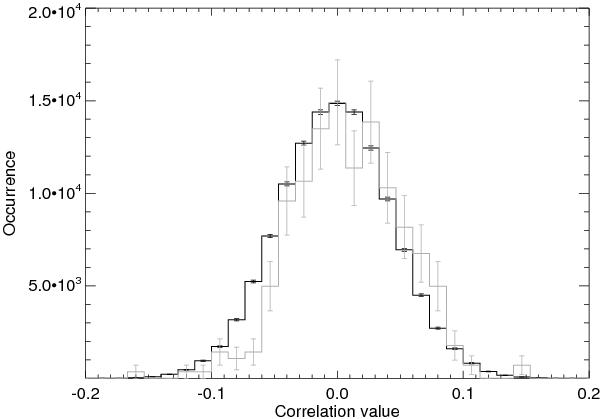
Histogram of correlation values away from the expected planet velocity (+10−400 km s-1 with respect to the planet), and those at the planet velocity (grey line, scaled), for detectors 2−4 combined.
Current usage metrics show cumulative count of Article Views (full-text article views including HTML views, PDF and ePub downloads, according to the available data) and Abstracts Views on Vision4Press platform.
Data correspond to usage on the plateform after 2015. The current usage metrics is available 48-96 hours after online publication and is updated daily on week days.
Initial download of the metrics may take a while.