Free Access
Fig. 1
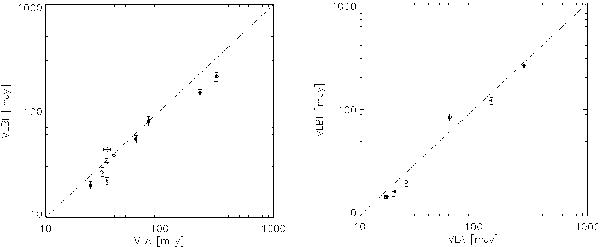
Flux densities of VLBI vs VLA at 5 (left) and 8 GHz (right), for all of the sources with both measurements. The dashed line indicates a slope equal to 1. The outliers (σvar > 3) are sources 0756+37, 1406+34 and 1014+05 at 5 GHz, and 1237+47 at 8.4 GHz.
Current usage metrics show cumulative count of Article Views (full-text article views including HTML views, PDF and ePub downloads, according to the available data) and Abstracts Views on Vision4Press platform.
Data correspond to usage on the plateform after 2015. The current usage metrics is available 48-96 hours after online publication and is updated daily on week days.
Initial download of the metrics may take a while.