Fig. 7
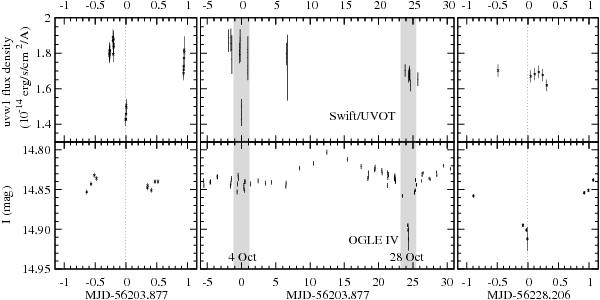
Joint UV and I light curve of LXP 169 covering the two eclipses of October 2012, with data from Swift/UVOT (upper panel) and OGLE-IV (lower panel). The left and right panels show close-ups of the light curves centred on the two eclipses, using the transit ephemeris derived in Sect. 4.1. The shaded areas in the middle panel indicate the zoomed-in regions.
Current usage metrics show cumulative count of Article Views (full-text article views including HTML views, PDF and ePub downloads, according to the available data) and Abstracts Views on Vision4Press platform.
Data correspond to usage on the plateform after 2015. The current usage metrics is available 48-96 hours after online publication and is updated daily on week days.
Initial download of the metrics may take a while.