Fig. 6
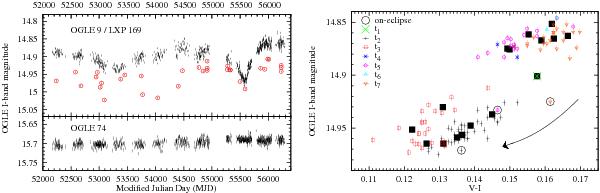
Left: OGLE light curves for the two nearest stars from LXP 169. The top panel shows the star we identify as the true optical counterpart (see Sect. 3.1). Data taken before MJD 55 000 belong to the OGLE-III dataset, data taken afterwards are from OGLE-IV. The transit events (Sect. 3.3) are marked by red circles. Right: colour–magnitude diagram of the optical counterpart of LXP 169, constructed from OGLE-IV V and I-band measurements. Data points are binned in seven 150 d long blocks (t1 to t7, in chronological order) to show the path of the star in the diagram. The big filled squares are averaged values in intervals of about ten consecutive measurements, excluding data obtained during transit events (circled in black). The curved arrow indicates how the loop-like track is traversed clock-wise.
Current usage metrics show cumulative count of Article Views (full-text article views including HTML views, PDF and ePub downloads, according to the available data) and Abstracts Views on Vision4Press platform.
Data correspond to usage on the plateform after 2015. The current usage metrics is available 48-96 hours after online publication and is updated daily on week days.
Initial download of the metrics may take a while.