Free Access
Fig. 3
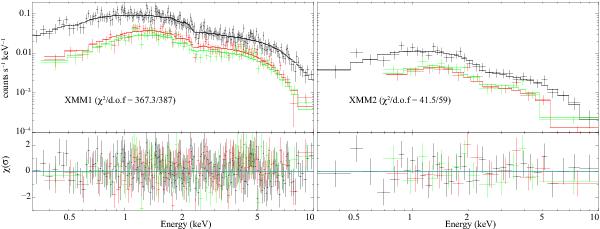
EPIC spectrum of LXP 169 for observation XMM1 (left) and XMM2 (right). The black, red, and green points are data from pn, MOS1, and MOS2 cameras, respectively. The histograms show the folded best-fit model (absorbed power law). Residuals are shown in the lower panels in terms of σ.
Current usage metrics show cumulative count of Article Views (full-text article views including HTML views, PDF and ePub downloads, according to the available data) and Abstracts Views on Vision4Press platform.
Data correspond to usage on the plateform after 2015. The current usage metrics is available 48-96 hours after online publication and is updated daily on week days.
Initial download of the metrics may take a while.