Fig. 5
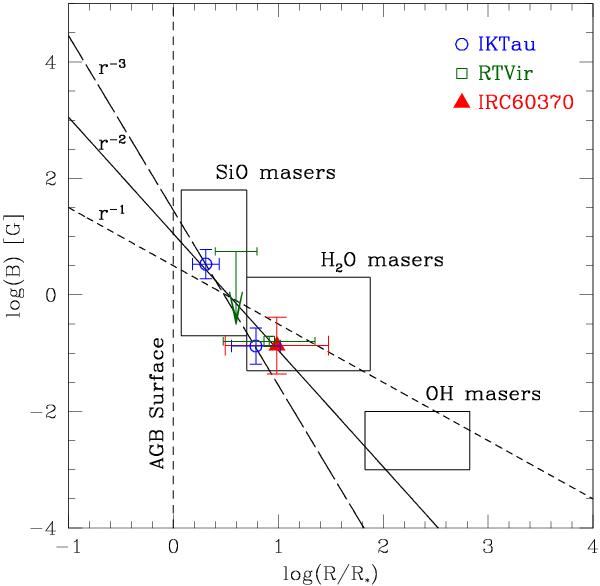
Magnetic field strength along the line of sight versus the radial distance of the masers to the star. The black boxes show typical regions of the plot where results from the literature for SiO, H2O, and OH maser occur, and they are normalized for R∗ = 1 (Vlemmings et al. 2002, 2005; Herpin et al. 2006; Rudnitski et al. 2010). Our measurements are shown by the hollow blue circles (IK Tau), hollow green squares (RT Vir), and filled red triangles (IRC+60370). The short-dashed, solid, and long-dashed inclined lines show a dependence ∝ R-1, ∝ R-2, and ∝ R-3 for the magnetic field, respectively. The position of the AGB surface of a star with radius of 1 AU is also shown.
Current usage metrics show cumulative count of Article Views (full-text article views including HTML views, PDF and ePub downloads, according to the available data) and Abstracts Views on Vision4Press platform.
Data correspond to usage on the plateform after 2015. The current usage metrics is available 48-96 hours after online publication and is updated daily on week days.
Initial download of the metrics may take a while.