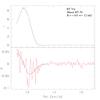
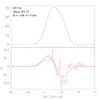
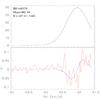
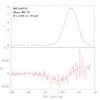
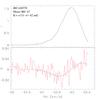
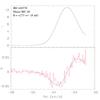
Fig. 2
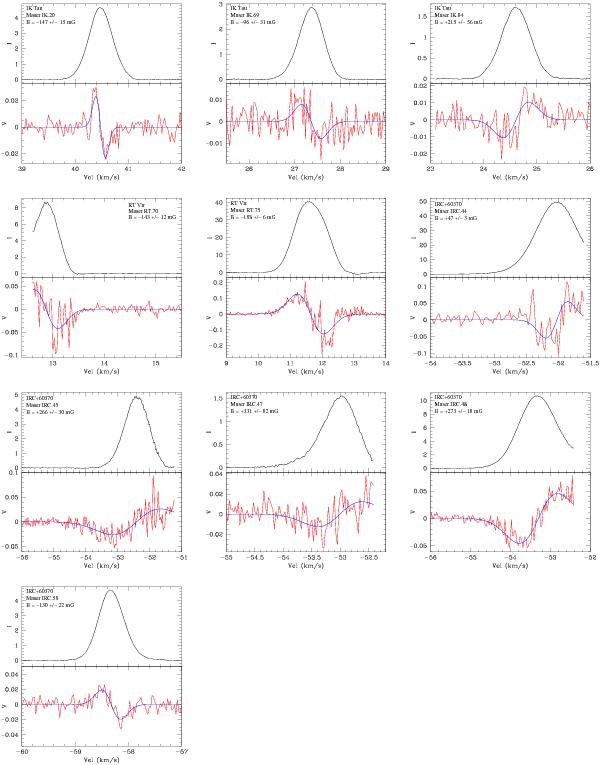
Stokes I (top; black line) and V (bottom; red line) spectra of all maser features in which we detected circular polarization. The blue lines show the best model fit to each V spectrum. The source, the maser identification, and the magnetic field strength along the line of sight given by the fit are presented in top-left corner of each plot. The x-axis shows VLSR in km s-1 and the y-axis the intensity in Jy/beam.
Current usage metrics show cumulative count of Article Views (full-text article views including HTML views, PDF and ePub downloads, according to the available data) and Abstracts Views on Vision4Press platform.
Data correspond to usage on the plateform after 2015. The current usage metrics is available 48-96 hours after online publication and is updated daily on week days.
Initial download of the metrics may take a while.