Fig. 1
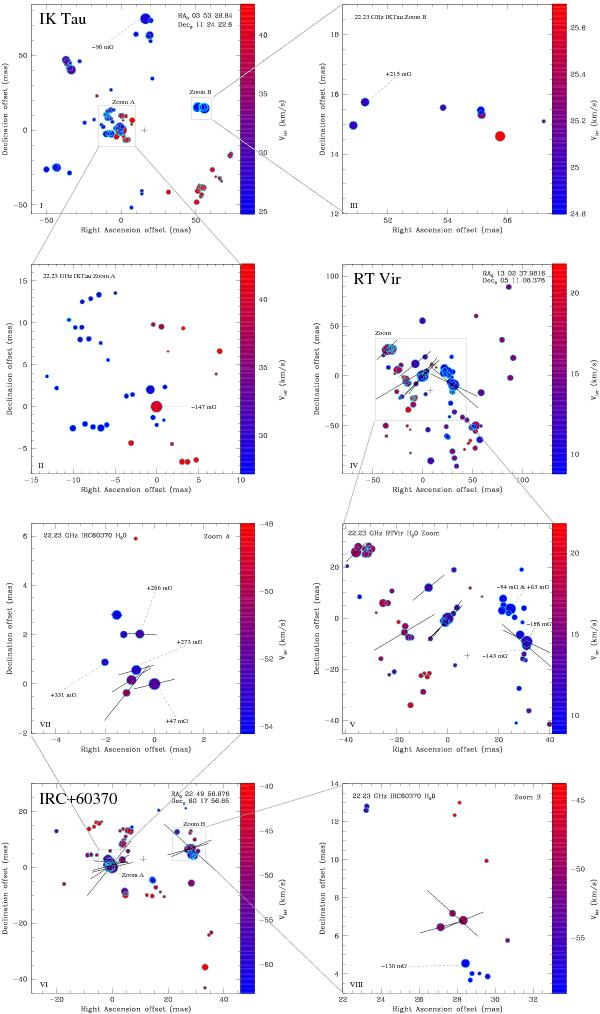
Maps of the maser features detected toward RT Vir, IK Tau, and IRC+60370. The size of the circles is proportional to the maser flux densities, and their colors show the velocity scale. The black crosses indicate the stellar positions (see Sect. 4.3). The black lines indicate the EVPA (for RT Vir, they could not be calibrated in terms of absolute EVPA), and their lengths are proportional to the fractional linear polarization. The magnetic field strength along the line of sight are also shown for the features in which we detected circular polarization. The x-axis is the projected offset on the plane of the sky in the direction of right ascension. The y-axis is the declination offset. The offsets are with respect to the reference maser.
Current usage metrics show cumulative count of Article Views (full-text article views including HTML views, PDF and ePub downloads, according to the available data) and Abstracts Views on Vision4Press platform.
Data correspond to usage on the plateform after 2015. The current usage metrics is available 48-96 hours after online publication and is updated daily on week days.
Initial download of the metrics may take a while.