Free Access
Fig. 7
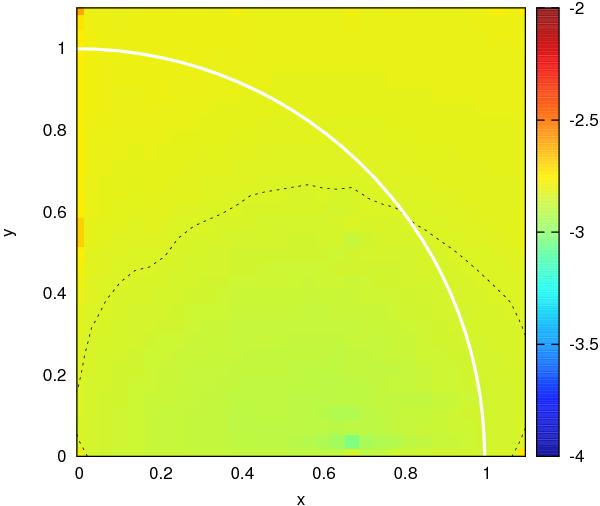
Same legend and same color code as for Fig. 5, but a radially inhomogeneous sphere (boundary in white; see text). The mean index is −2.83 (dashed line). The P-grid (R,z) is a square, larger than the sphere’s radius by 10%.
Current usage metrics show cumulative count of Article Views (full-text article views including HTML views, PDF and ePub downloads, according to the available data) and Abstracts Views on Vision4Press platform.
Data correspond to usage on the plateform after 2015. The current usage metrics is available 48-96 hours after online publication and is updated daily on week days.
Initial download of the metrics may take a while.