Fig. 9
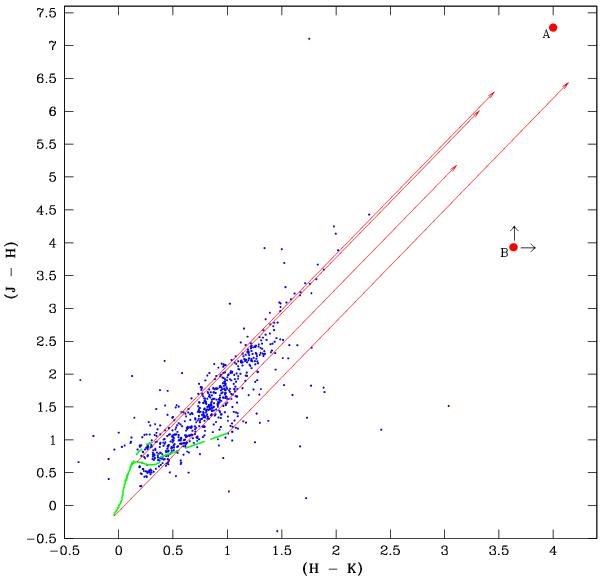
WFCAM JHK colour–colour diagram of a 2′ × 2′ region surrounding IRAS 18345; UKIDSS data obtained in better sky conditions are used. The blue dots show the colours of point sources detected. The red dots are the colours of sources “A” and “B” derived from the most recent observations. The continuous green lines show the colours of unreddened main sequence and red-giant stars taken from Tokunaga et al. (2000). The long-dashed green line shows the loci of CTTS from Meyer et al. (1997). The long red arrows show the reddening vectors for AV ≤ 50 derived from the interstellar extinction law given by Rieke & Lebofsky (1985).
Current usage metrics show cumulative count of Article Views (full-text article views including HTML views, PDF and ePub downloads, according to the available data) and Abstracts Views on Vision4Press platform.
Data correspond to usage on the plateform after 2015. The current usage metrics is available 48-96 hours after online publication and is updated daily on week days.
Initial download of the metrics may take a while.