Fig. 6
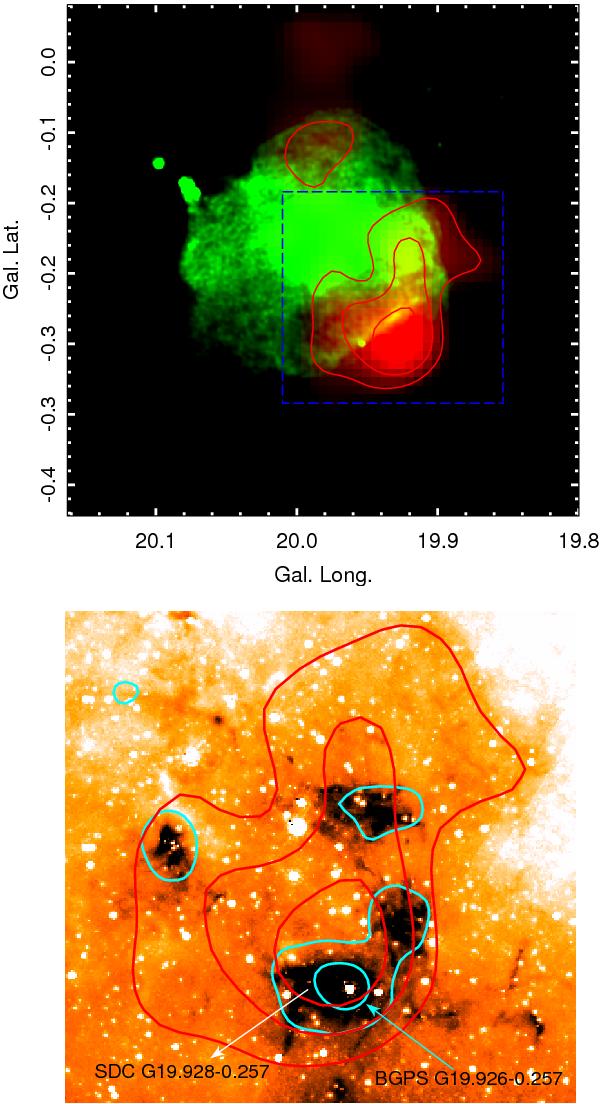
Top: two-color image toward G20.0-0.2. In green: radio continuum emission at 20 cm. In red: emission of the 13CO integrated between 64.3 and 68.6 km s-1 (contour levels are 10.0, 14.6, and 19.0 K km s-1). The blue rectangle indicates the area shown in the adjacent figure. Bottom: Spitzer-IRAC 8 μm band. The red contours are the 13CO emission and the cyan contours are the 1.1 mm continuum emission from the BGPS (contour levels are 0.1 and 0.5 Jy/Beam). The most intense molecular emission (traced by the 19.0 K km s-1 contour level) shows a spatial correspondence with the millimeter source BGPS G19.926-0.257 and the dark cloud SDC G19.928-0.257.
Current usage metrics show cumulative count of Article Views (full-text article views including HTML views, PDF and ePub downloads, according to the available data) and Abstracts Views on Vision4Press platform.
Data correspond to usage on the plateform after 2015. The current usage metrics is available 48-96 hours after online publication and is updated daily on week days.
Initial download of the metrics may take a while.