Fig. 8
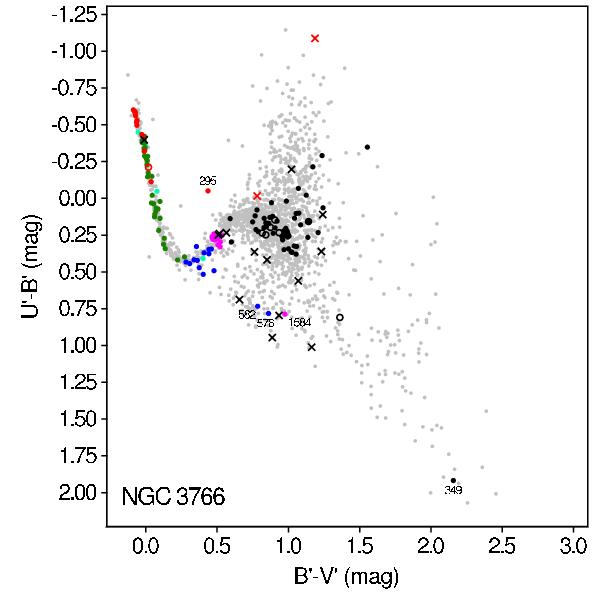
Color–color diagram, with symbols as in Fig. 7. Only stars with good light curves in V′, B′ and U′ are plotted, except for binary stars which are plotted in red if their U′ light curve is not good. Individual periodic variables whose variability classification are debated in Sect. 5 are labeled with their star id next to the marker.
Current usage metrics show cumulative count of Article Views (full-text article views including HTML views, PDF and ePub downloads, according to the available data) and Abstracts Views on Vision4Press platform.
Data correspond to usage on the plateform after 2015. The current usage metrics is available 48-96 hours after online publication and is updated daily on week days.
Initial download of the metrics may take a while.