Fig. B.2
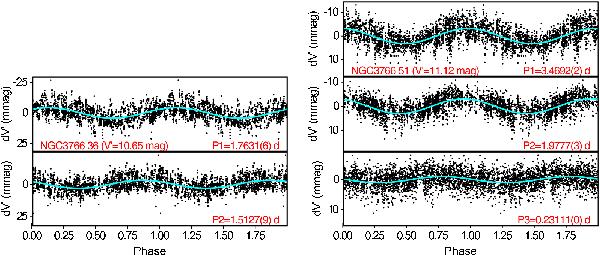
Same as Fig. B.1, but for the multiperiodic variables of group 1 (SPB candidates). All significant frequencies are shown, one panel per frequency. The data shown for each frequency is the residual obtained by subtracting from the original data all earlier frequencies, from top to bottom panels. The period used to fold the data in each panel is written in the lower right corner of each panel.
Current usage metrics show cumulative count of Article Views (full-text article views including HTML views, PDF and ePub downloads, according to the available data) and Abstracts Views on Vision4Press platform.
Data correspond to usage on the plateform after 2015. The current usage metrics is available 48-96 hours after online publication and is updated daily on week days.
Initial download of the metrics may take a while.