Fig. B.1
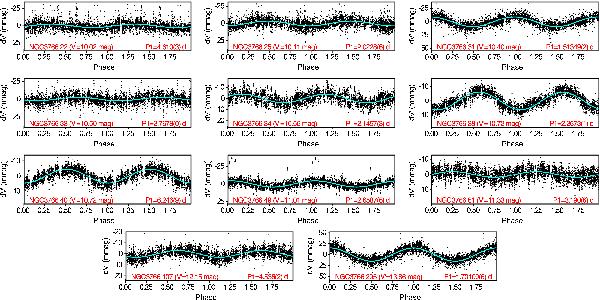
Folded light curves in V′ of the monoperiodic variables of group 1 (SPB candidates). The mean V′ magnitude has been subtracted from the light curves. Cyan lines represent a sine fit to the data using the frequency found by the period search algorithm. The star identification is written in the lower left corner of each figure, with the mean V′ magnitude in parenthesis. The period used to fold the data is written in the lower right corner of each figure.
Current usage metrics show cumulative count of Article Views (full-text article views including HTML views, PDF and ePub downloads, according to the available data) and Abstracts Views on Vision4Press platform.
Data correspond to usage on the plateform after 2015. The current usage metrics is available 48-96 hours after online publication and is updated daily on week days.
Initial download of the metrics may take a while.