Fig. 21
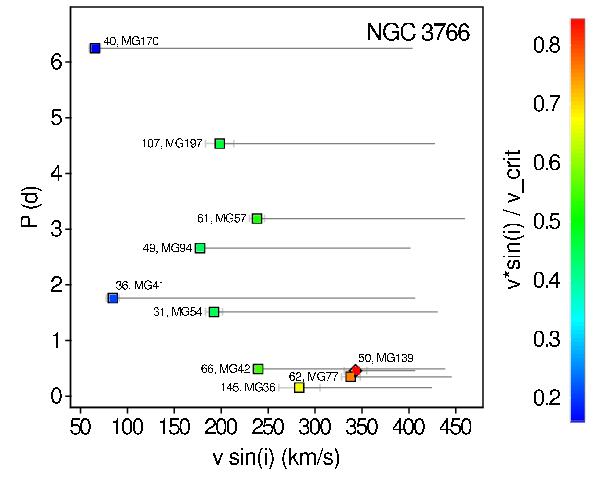
Period as a function of vsin(i) for the periodic variables in common with the stars spectroscopically observed by McSwain et al. (2008). The projected rotational velocity vsin(i) is taken from those authors. The markers have the same meaning as those in Fig. 20, with the colors related to the vsin(i)/vcrit ratio according to the color scale plotted on the right of the figure, vcrit being the critical rotational velocity. The four group 2 stars are the ones having P < 1 d, the other ones belonging to group 1. Horizontal lines indicate the range of possible rotational velocities v for each star, i.e. from vsin(i) to vcrit. Our star id is indicated next to each marker, followed by the star id from McSwain & Gies (2005).
Current usage metrics show cumulative count of Article Views (full-text article views including HTML views, PDF and ePub downloads, according to the available data) and Abstracts Views on Vision4Press platform.
Data correspond to usage on the plateform after 2015. The current usage metrics is available 48-96 hours after online publication and is updated daily on week days.
Initial download of the metrics may take a while.