Fig. 20
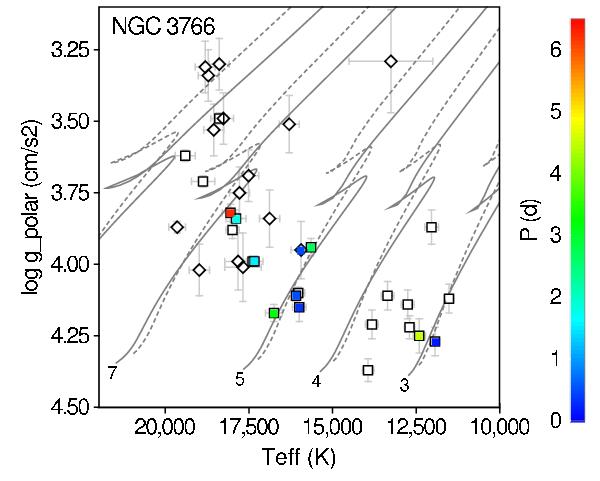
Location in the (Teff,log gpolar) HR diagram of the B (squares) and Be (diamonds) stars of McSwain et al. (2008) that fall in our field of view. Open markers identify non-periodic variables, and filled markers periodic variables with the color of the marker related to the period (the dominant one for multiperiodic variables) according to the color scale on the right. The four dark blue markers represent group 2 stars (periods less than 1 day), the other six color markers representing SPB candidates. Tracks of non-rotating stellar evolution models are shown by continuous lines for various initial stellar masses, as labeled next to the tracks. Tracks with initial models rotating at 40% the critical rotational velocity are shown by dashed lines. All tracks are taken from Ekström et al. (2012).
Current usage metrics show cumulative count of Article Views (full-text article views including HTML views, PDF and ePub downloads, according to the available data) and Abstracts Views on Vision4Press platform.
Data correspond to usage on the plateform after 2015. The current usage metrics is available 48-96 hours after online publication and is updated daily on week days.
Initial download of the metrics may take a while.