Fig. 2
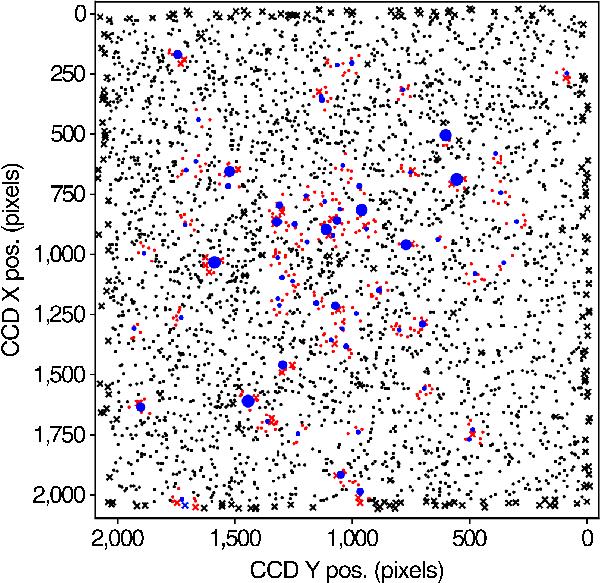
Location on the CCD of all stars with more than 100 good points in their light curve. The seventy brightest stars are plotted in blue, with the size of the marker proportional to the brightness of the star. Stars that lie closer than 50 pixels on the CCD from one of those bright stars are plotted in red. Crosses identify stars that have more than 20% bad points in their light curves (see Sect. 2.3).
Current usage metrics show cumulative count of Article Views (full-text article views including HTML views, PDF and ePub downloads, according to the available data) and Abstracts Views on Vision4Press platform.
Data correspond to usage on the plateform after 2015. The current usage metrics is available 48-96 hours after online publication and is updated daily on week days.
Initial download of the metrics may take a while.