Fig. 19
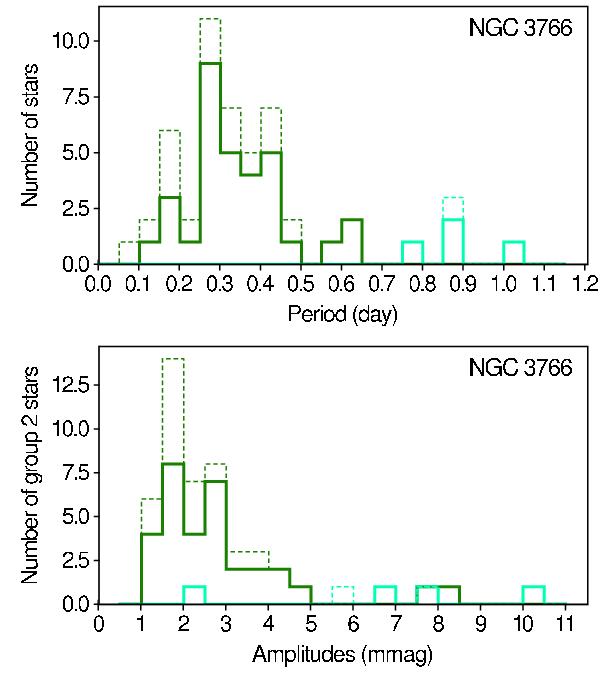
Histograms of the periods (top panel) and amplitudes (bottom panel) of group 2 stars. Solid lines give the histograms for the periods and amplitudes of the dominant detected frequency, while dotted lines show the histograms considering all frequencies of the multiperiodic group 2 variables. The bulk of stars with periods between 0.1 and 0.7 d are shown in dark green, while the few stars with periods between 0.7 and 1.1 d are displayed in cyan, in agreement with the color codes adopted in Fig. 10.
Current usage metrics show cumulative count of Article Views (full-text article views including HTML views, PDF and ePub downloads, according to the available data) and Abstracts Views on Vision4Press platform.
Data correspond to usage on the plateform after 2015. The current usage metrics is available 48-96 hours after online publication and is updated daily on week days.
Initial download of the metrics may take a while.