Fig. 17
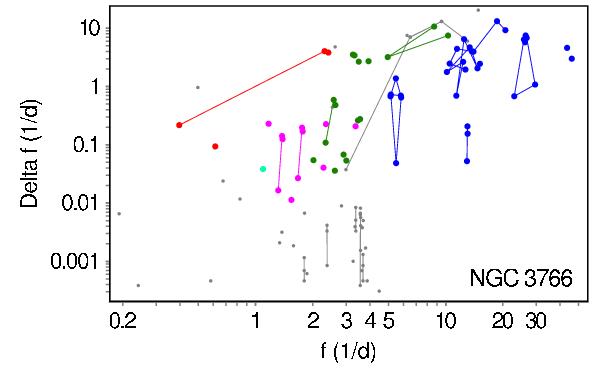
Frequency separations of all frequency pairs belonging to multiperiodic variables, as a function of the mean of the considered pair of frequencies. The data for stars with more than two frequencies are connected with a line. Colors in all panels indicate the group to which the star belongs, coded as in Fig. 10, except for group 5 stars which are colored in gray (small points) instead of black.
Current usage metrics show cumulative count of Article Views (full-text article views including HTML views, PDF and ePub downloads, according to the available data) and Abstracts Views on Vision4Press platform.
Data correspond to usage on the plateform after 2015. The current usage metrics is available 48-96 hours after online publication and is updated daily on week days.
Initial download of the metrics may take a while.