Fig. 16
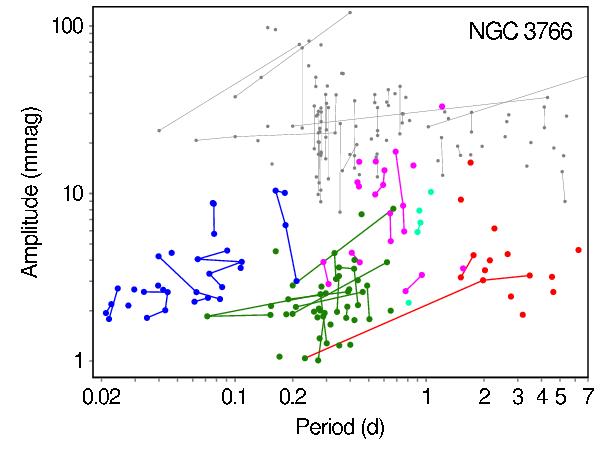
Period–amplitude diagram, in logarithms, of all periodic variables. Multiple periods of a same star are connected with straight lines. Colors indicate the group to which the period belongs, coded as in Fig. 10 except for group 5 which is plotted in small gray points instead of black. The X-axis range has been truncated at 7 d for sake of clarity. Only two stars fall outside this range, stars 349 and 1428 with P = 61.5 and 888 d, respectively, both belonging to group 5.
Current usage metrics show cumulative count of Article Views (full-text article views including HTML views, PDF and ePub downloads, according to the available data) and Abstracts Views on Vision4Press platform.
Data correspond to usage on the plateform after 2015. The current usage metrics is available 48-96 hours after online publication and is updated daily on week days.
Initial download of the metrics may take a while.