Fig. 11
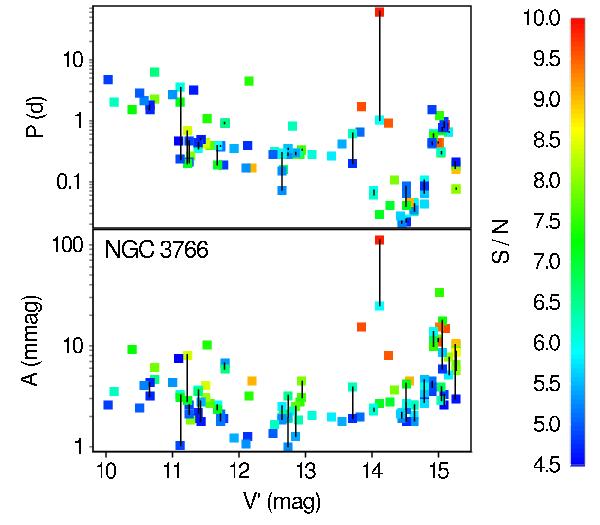
Periods (top panel) and associated pulsation amplitudes (bottom panel) of the periodic variables brighter than V′ = 15.5 mag, as a function of their V′ magnitude. Multiple periods of the same object are connected with solid lines (note that the period separations of multiperiodic variables are often much smaller than the periods themselves, resulting in the vertical solid lines being reduced to a black point inside the markers in the top panel). The color of each point indicates the S/N of the peak in the periodogram corresponding to the given frequency, according to the color scale displayed on the right of the figure. When overlapping, the marker of the highest S/N appears in the plot.
Current usage metrics show cumulative count of Article Views (full-text article views including HTML views, PDF and ePub downloads, according to the available data) and Abstracts Views on Vision4Press platform.
Data correspond to usage on the plateform after 2015. The current usage metrics is available 48-96 hours after online publication and is updated daily on week days.
Initial download of the metrics may take a while.