Fig. 7
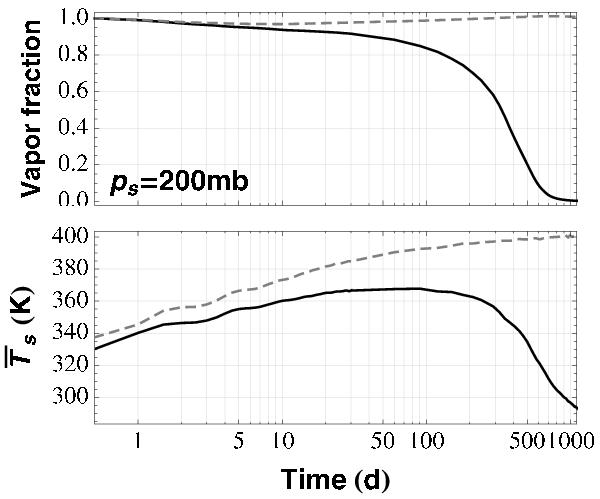
Time evolution of the fraction of water vapor in the atmosphere over the total water amount and of the mean surface temperature for Gl 581 c with a 200 mbar background atmosphere. The black solid curve represents a model initialized with a water vapor column of 150 kg/m2 and the gray dashed one with 250 kg/m2. After a short transitional period, either the water collapses on the ground in a few hundred days (solid curve) or the atmosphere reaches a runaway greenhouse state (dashed curve).
Current usage metrics show cumulative count of Article Views (full-text article views including HTML views, PDF and ePub downloads, according to the available data) and Abstracts Views on Vision4Press platform.
Data correspond to usage on the plateform after 2015. The current usage metrics is available 48-96 hours after online publication and is updated daily on week days.
Initial download of the metrics may take a while.