Fig. 2
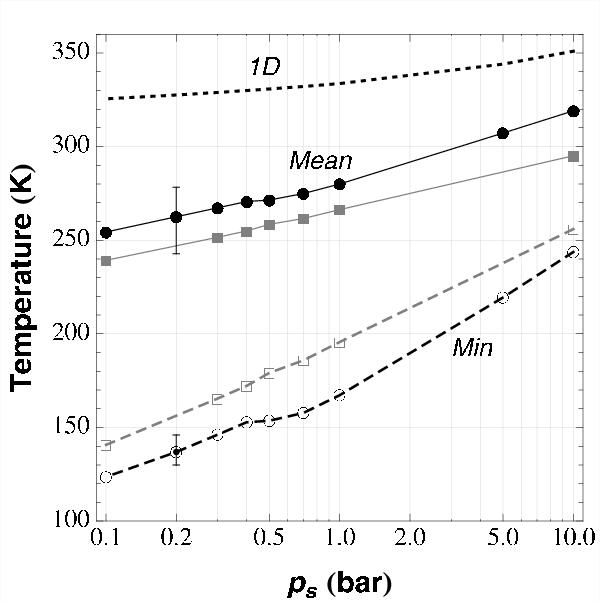
Globally averaged (solid, filled) and minimum (dashed, empty) temperatures as a function of surface pressure for Gl 581 c (black circles) and HD 85512 b (gray squares). For comparison, the surface temperature of the 1D model for Gl 581 c is also shown (dotted curve). The error bars on the 200 mbar case show the temperatures reached by varying the surface albedo between 0.1 and 0.5.
Current usage metrics show cumulative count of Article Views (full-text article views including HTML views, PDF and ePub downloads, according to the available data) and Abstracts Views on Vision4Press platform.
Data correspond to usage on the plateform after 2015. The current usage metrics is available 48-96 hours after online publication and is updated daily on week days.
Initial download of the metrics may take a while.