Fig. 14
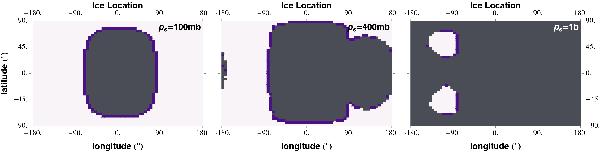
Ice distribution for different surface pressures for Gl 581 c (ps = 100 mb, 400 mb and 1 b from left to right). Dry regions are in dark gray, ice caps are shown in white, and liquid water is in blue. For background surface pressures above 300 mb, the greenhouse effect of water vapor is sufficient to melt water even on the night side.
Current usage metrics show cumulative count of Article Views (full-text article views including HTML views, PDF and ePub downloads, according to the available data) and Abstracts Views on Vision4Press platform.
Data correspond to usage on the plateform after 2015. The current usage metrics is available 48-96 hours after online publication and is updated daily on week days.
Initial download of the metrics may take a while.