Fig. 2
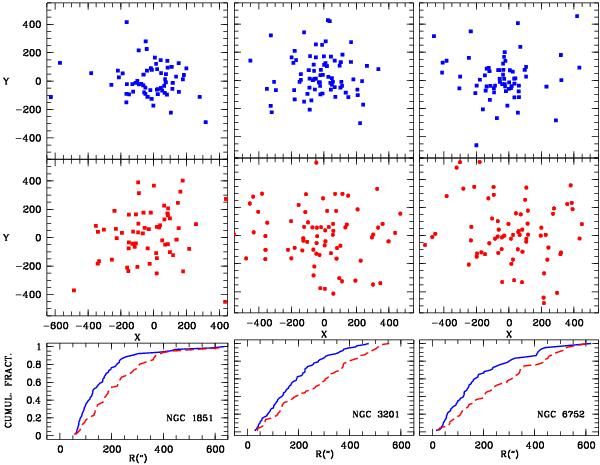
Upper and middle panels: position of IP (blue dotes) and IR (red dotes) RGB stars in the fields of the three GCs. Lower panels: cumulative RDs for IP (blue continuous line) and IR (red dashed line) RGs. PRAD from the cluster centers, (R), and the rectangular coordinates X and Y (whose axes are aligned along the α and δ axes, respectively) with respect to the centers of the clusters are expressed in arcseconds.
Current usage metrics show cumulative count of Article Views (full-text article views including HTML views, PDF and ePub downloads, according to the available data) and Abstracts Views on Vision4Press platform.
Data correspond to usage on the plateform after 2015. The current usage metrics is available 48-96 hours after online publication and is updated daily on week days.
Initial download of the metrics may take a while.