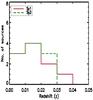
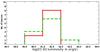
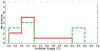
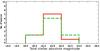
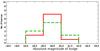
Fig. 1
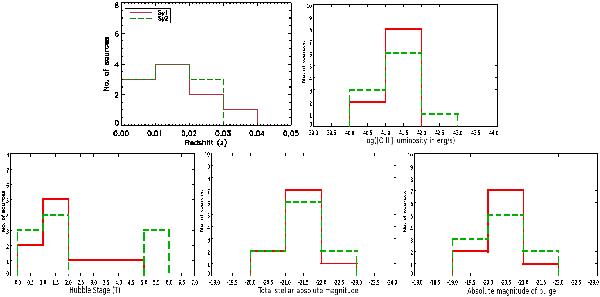
Histograms showing matched distributions of Seyfert types 1s and 2s in redshift, [O III] λ5007 Å luminosity, Hubble type of the host galaxy, total stellar absolute magnitude of the host galaxy, and absolute magnitude of the bulge. The histograms for types 1s and 2s are plotted with red colored solid lines and green colored dashed lines, respectively.
Current usage metrics show cumulative count of Article Views (full-text article views including HTML views, PDF and ePub downloads, according to the available data) and Abstracts Views on Vision4Press platform.
Data correspond to usage on the plateform after 2015. The current usage metrics is available 48-96 hours after online publication and is updated daily on week days.
Initial download of the metrics may take a while.