Fig. 3
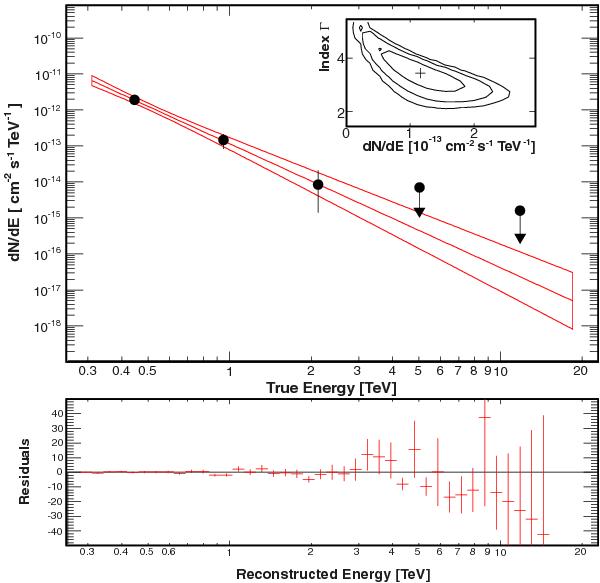
Spectrum of SHBL J001355.9–185406 measured with H.E.S.S. using the Model analysis. Top panel: the butterfly represents the 1σ contour for the best-fit model. The spectrum is obtained with the forward-folding method in Piron et al. (2001). The data points are derived a posteriori and should be considered as residuals. For bins with a significance below 2σ, upper limits at the 95% confidence level are computed. The inset gives the 1, 2, and 3σ confidence levels in the power-law index vs differential flux at 1 TeV plane. Bottom panel: residuals of the fit, with the binning used in the forward-folding method.
Current usage metrics show cumulative count of Article Views (full-text article views including HTML views, PDF and ePub downloads, according to the available data) and Abstracts Views on Vision4Press platform.
Data correspond to usage on the plateform after 2015. The current usage metrics is available 48-96 hours after online publication and is updated daily on week days.
Initial download of the metrics may take a while.