Fig. 2
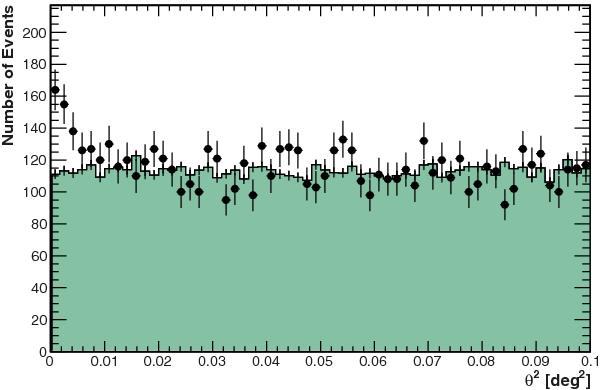
Distribution of ON-source events (circles) as a function of the square of the angular distance θ2 from the source position. A cut at θ = 0.1° is used to define the ON region with standard cuts. The distribution of normalized OFF-source (solid histogram) is flat and matches the distribution of the ON-source events at large θ2, which reflects a proper background subtraction.
Current usage metrics show cumulative count of Article Views (full-text article views including HTML views, PDF and ePub downloads, according to the available data) and Abstracts Views on Vision4Press platform.
Data correspond to usage on the plateform after 2015. The current usage metrics is available 48-96 hours after online publication and is updated daily on week days.
Initial download of the metrics may take a while.