Fig. 6
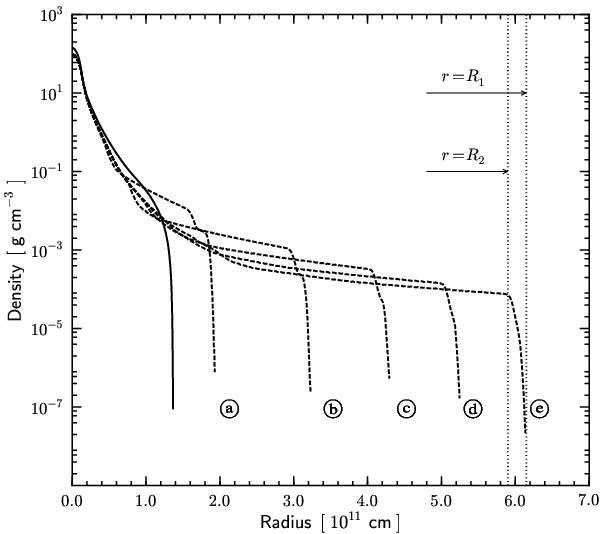
Density profile of the MS_110 model for different times after the SN explosion. The black solid line corresponds to the initial density profile of the star at the moment of the explosion. All black dashed lines froma ◯toe ◯show the radial density distribution of the star (0.4,0.8···2.0) × 104 s after the impact in time intervals of 4000 s.
Current usage metrics show cumulative count of Article Views (full-text article views including HTML views, PDF and ePub downloads, according to the available data) and Abstracts Views on Vision4Press platform.
Data correspond to usage on the plateform after 2015. The current usage metrics is available 48-96 hours after online publication and is updated daily on week days.
Initial download of the metrics may take a while.