Fig. 1
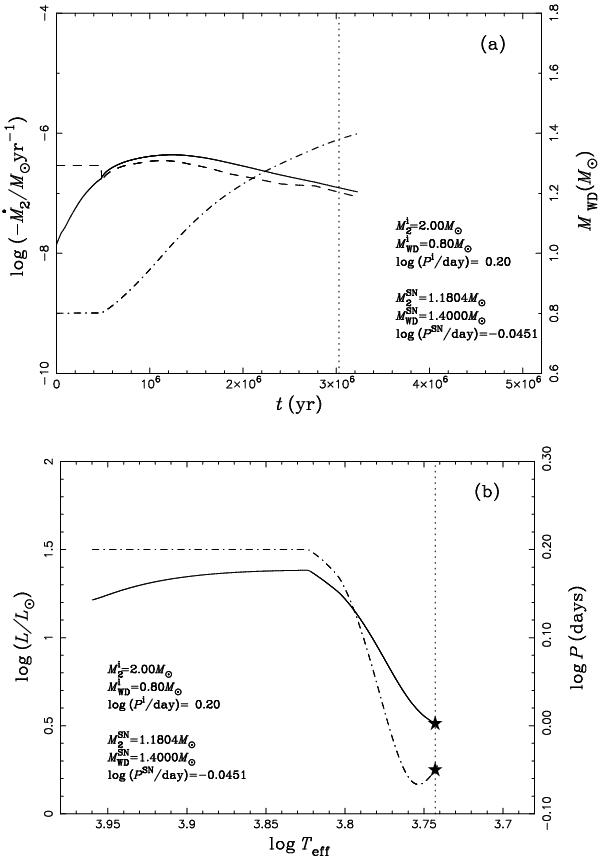
Binary-evolution calculation of the MS_110 progenitor model. In panel a), the solid, dashed, and dash-dotted curves show the mass-transfer rate, Ṁ2, the mass-growth rate of the CO WD, ṀCO, and the mass of the CO WD, MWD. In panel b), the evolutionary track of the donor star is shown as a solid curve and the evolution of the orbital period is shown as a dashed-dotted curve. The dotted vertical lines in both panels and asterisks in panel b) indicate the position where the WD explodes as an SN Ia.
Current usage metrics show cumulative count of Article Views (full-text article views including HTML views, PDF and ePub downloads, according to the available data) and Abstracts Views on Vision4Press platform.
Data correspond to usage on the plateform after 2015. The current usage metrics is available 48-96 hours after online publication and is updated daily on week days.
Initial download of the metrics may take a while.