Fig. 8
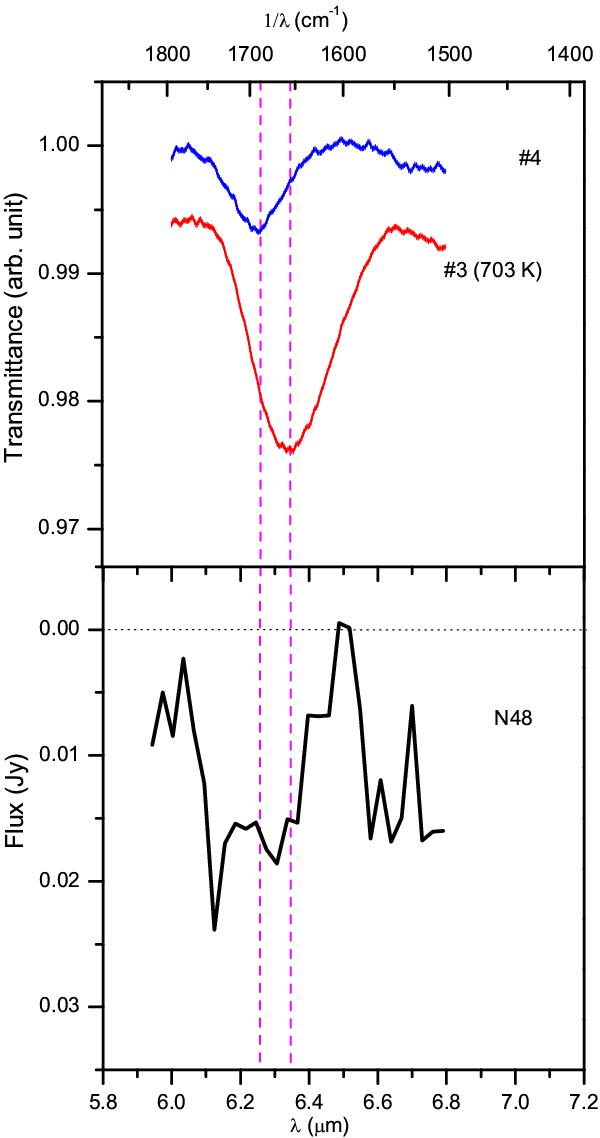
Compatibility of 6.2 μm bands in laboratory results (top panel) and IRS SL spectra (bottom panel) of N49 with Spitzer IRAC spectral response curves. Nod 1 position spectra are used only (Seok et al. 2012). The vertical dashed lines show the band position range at approximately 6.25 μm and 6.35 μm bands for #4 and #3 (703 K).
Current usage metrics show cumulative count of Article Views (full-text article views including HTML views, PDF and ePub downloads, according to the available data) and Abstracts Views on Vision4Press platform.
Data correspond to usage on the plateform after 2015. The current usage metrics is available 48-96 hours after online publication and is updated daily on week days.
Initial download of the metrics may take a while.