Fig. 3
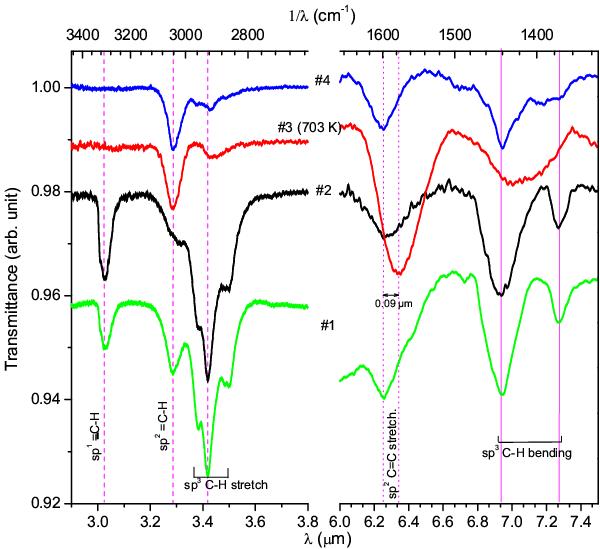
Experimental spectra in the ranges from 2.9 μm to 3.8 μm and from 6.0 μm to 7.5 μm for hydrocarbon samples (#1 to #4). The vertical dashed lines at 3.03, 3.3 and 3.4 μm bands represent the sp1 ≡ C-H stretching, the aromatic sp =C-H stretching and the aliphatic sp3 -C-H stretching, respectively. The vertical dotted lines show the difference in the 6.2 μm positions. The vertical solid lines represent the aliphatic sp3 -C-H bending at 6.94 μm and 7.27 μm.
Current usage metrics show cumulative count of Article Views (full-text article views including HTML views, PDF and ePub downloads, according to the available data) and Abstracts Views on Vision4Press platform.
Data correspond to usage on the plateform after 2015. The current usage metrics is available 48-96 hours after online publication and is updated daily on week days.
Initial download of the metrics may take a while.