Fig. 7
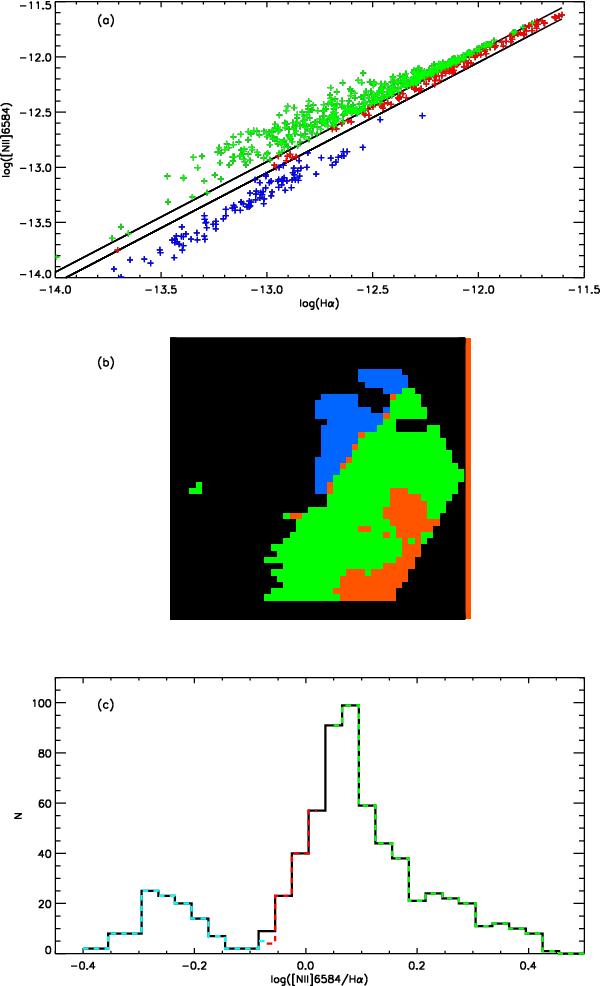
Relations between [Nii] and Hα for the edge pointing. Colours help us locate points spatially: red corresponds to points with log (Hα) =log ([Nii]) ± 0.05, blue to points with log (Hα) >log ([Nii]), and green to points where log (Hα) <log ([Nii]). From the top to the bottom: a) log ([Nii]λ6584) vs. log (Hα). All the spaxels of the intensity maps (in units of log (erg cm-2 s-1) are represented in the diagram with crosses. Black lines with unitary slope represent the limits. b) PPAK FoV of the edge pointing with the zones defined in plot a. c) Statistical frequency distributions of the log ([Nii]/Hα) map. Black solid line represents the distributions of all the spaxels, and coloured dashed lines represent the regions defined above. See text for details.
Current usage metrics show cumulative count of Article Views (full-text article views including HTML views, PDF and ePub downloads, according to the available data) and Abstracts Views on Vision4Press platform.
Data correspond to usage on the plateform after 2015. The current usage metrics is available 48-96 hours after online publication and is updated daily on week days.
Initial download of the metrics may take a while.