Free Access
Fig. 6
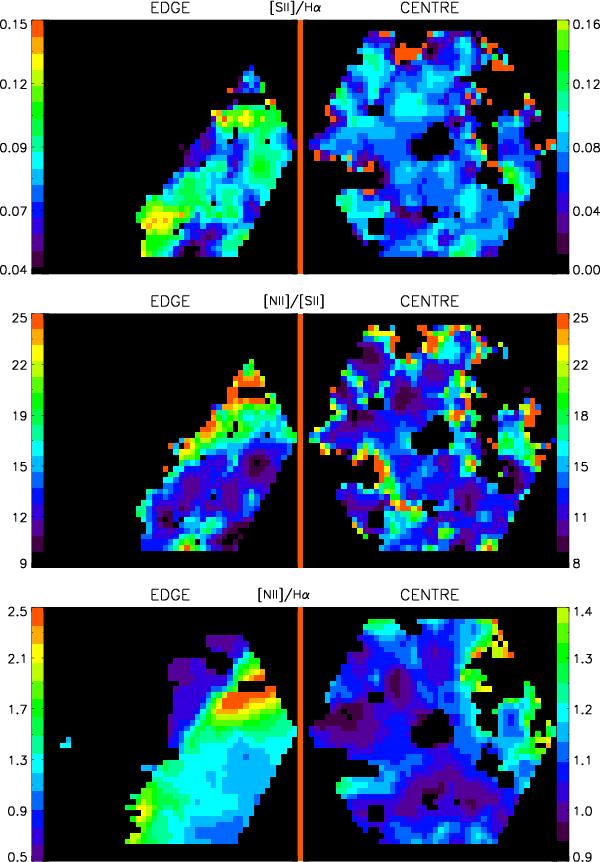
Derived maps of the emission line ratios of the two pointings: edge (left) and centre (right). Top: [Sii]λλ6717, 6731/Hα. Middle: [Nii]λ6584/[Sii]λλ6717, 6731. Bottom: ([Nii]λλ6584/Hα. Orientations and sizes as in Fig. 2.
Current usage metrics show cumulative count of Article Views (full-text article views including HTML views, PDF and ePub downloads, according to the available data) and Abstracts Views on Vision4Press platform.
Data correspond to usage on the plateform after 2015. The current usage metrics is available 48-96 hours after online publication and is updated daily on week days.
Initial download of the metrics may take a while.