Fig. 4
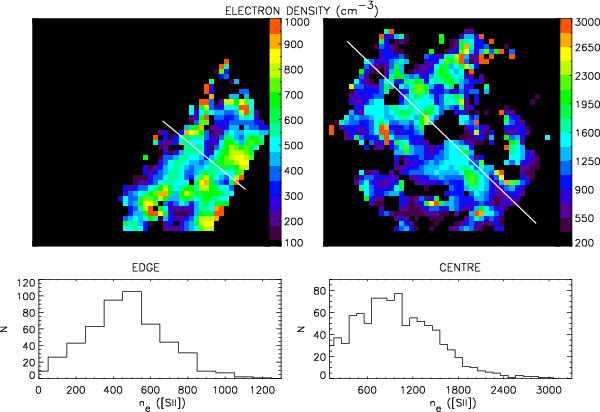
Electron density, ne, maps derived from the [Sii]λλ6717/6731 line ratios in units of cm-3. Orientations and sizes as in Fig. 2. On the bottom the statistical frequency distributions with a binning of 100 cm-3. The edge pointing is on the left, and the central on the right. The white lines across the maps (from NE to SW) represent the direction along which the cuts were extracted to study the radial variation of ne. See text for details.
Current usage metrics show cumulative count of Article Views (full-text article views including HTML views, PDF and ePub downloads, according to the available data) and Abstracts Views on Vision4Press platform.
Data correspond to usage on the plateform after 2015. The current usage metrics is available 48-96 hours after online publication and is updated daily on week days.
Initial download of the metrics may take a while.